import matplotlib.pyplot as plt
import numpy as np
# Example data (replace this with your variable)
std_max = np.random.rand(100)
# Simple line plot
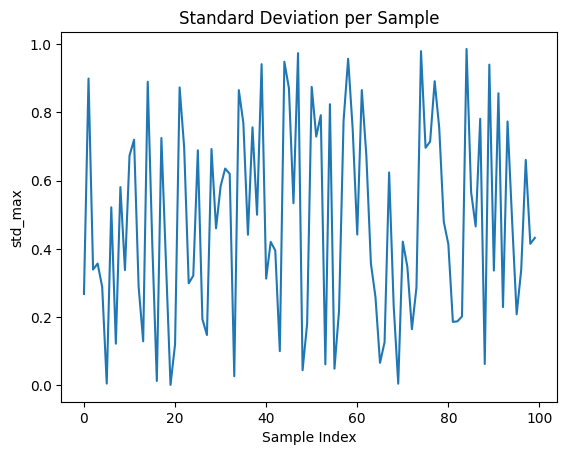
plt.plot(std_max)
plt.title("Standard Deviation per Sample")
plt.xlabel("Sample Index")
plt.ylabel("std_max")
plt.show()